In this month’s survey, we asked a bonus question to gauge respondents’ familiarity and experiences with the American Job Centers. The East Tennessee Human Resource Agency (ETHRA) operates 12 American Job Centers in the area that offer various workforce development services to both job seekers and area employers. Among the services that they offer, American Job Centers assist employers with finding qualified employees, offer on-the-job training contracts and provide various other resources to businesses.
Our survey results show that 74% of respondents are not familiar with the American Job Centers and the respondents who are aware of them have not used any of their services. This suggests that ETHRA may want to raise more awareness about American Job Center’s services to businesses in the community.
We also asked this month’s survey participants if local COVID-19 restrictions are negatively impacting their businesses and if so, in what ways. Survey respondents were split almost evenly between those indicating that they are being negatively impacted and those that indicated they are not.
Based on respondent feedback regarding the negative impacts of the local COVID-19 restrictions, seating and capacity limitations for social gatherings are mentioned most frequently as is the continued mixed messaging of local government on how to best address the pandemic. This inconsistent messaging by government on all levels continues to impact local consumer confidence, economic uncertainty and business stress.
There also is a ripple effect as businesses that can only serve a limited number of customers are indicating that they are unable to make enough money to make payments on items like rent or loans thereby affecting other businesses like commercial property management companies and financial lenders.
September unemployment rates continued trending downward since the reopening of the economy back in June. The Knoxville MSA’s unemployment rate in September was 4.7% (down from 6.6% in August and continuing a five-month downward trend from 13.5% in April during the COVID-19 lockdown). The same trending has held true for Knox County (4.6% in September, down from 6.5% in August and down from 12.9% in April), Tennessee (6.2% in September, down from 8.6% in August and down from 15% back in April), and the U.S. (7.7% in September, down from 8.5% in August and down from the 14.4% unemployment rate recorded in April).
The size of the total labor force has decreased in September from August in the Knoxville MSA by -1.2% (from 435,600 to 430,247), Knox County -1.2% (from 248,179 to 245,255), Tennessee by -2.1% (from 3,381,884 to 3,309,301), and the national labor force slightly dipped by -0.5% (from 160,966,000 to 160,073,000).
Below is the 13-month unemployment rates trending comparison for the four largest MSA’s in Tennessee:
Source: U.S. Bureau of Labor Statistics; Tennessee Dept. of Labor & Workforce Development
Job Market
For the month of September, there were 29,141 unique active job postings in the Knoxville MSA (up 3.9% from August but down 6% from last September). There were 17,508 unique active job postings in Knox County (up 5.5% from August but down 2.4% from this time last year).
The Top 10 industries (by number of job postings) in the Knoxville MSA in September were:
Below is the 13-month job postings trend for Knox County and the Knoxville MSA:
Source: EMSI Job Postings Analytics
ADP National Employment Report®
Each month, ADP, a large-scale payroll and human resources company releases their National Employment Report®, which provides a high-level look at month-over-month private-sector employment changes across the country.
The September report shows an increase of 749,000 in nonfarm private-sector employment (a much higher increase than the 428,000 jobs gain reported in August). Large firms (500+ employees) led the way by adding 297,000 jobs in September (adding further to the 298,000 jobs gain reported in August). Midsized businesses (50-499 employees) added 259,000 jobs in September (more than the 79,000 jobs added in August). Small businesses (1-49 employees) added 192,000 jobs in September (140,000 more than the August gain of 52,000).
ADP’s Small Business Report, which further synthesizes the small business landscape, shows that most of the 192,000 jobs gain came from the Very Small businesses (1-19 employees) accounting for 121,000 of the added jobs. The remainder of the job gains came from the small businesses that employ 20-49.
Sources: ADP; U.S. Bureau of Labor Statistics; Tennessee Department of Labor & Workforce Development
Talent Retention and Attraction
The title of an August 2019 article from Chief Executive stated that “What Makes a City Great? It’s All About the Talent.” We believe this to be the case, which is why our Path to Prosperity strategic vision includes a regional talent retention and attraction strategy as one of its priorities. While growth in all age groups is ideal, the ages between 25 and 54 years-old are the most critical. These are the people that fill jobs, start companies, have children, buy houses, etc. Unfortunately, at least from a number’s perspective, it is obvious that we have some work to do. According to Demographics Now (a data platform that makes current population estimates and projections based on U.S. Census decennial and American Community Survey data), the Knoxville MSA has experienced essentially no increase in the last decade.
As seen in the chart below, the estimated 2020 total of the 25 – 54 age group for our area is less than .05 percent more than it was ten years ago. At the same time, our fellow Tennessee regions of Nashville (14.7 percent) and Chattanooga (3.5 percent) (the Memphis MSA actually saw a 2.2 percent decrease) and peer communities such as Asheville (6.5 percent), Durham-Chapel Hill (11.6 percent), Greenville (6.6 percent), Lexington (2.0 percent), and Raleigh (18.2 percent) are expected to have moved the needle…in some cases fairly significantly.
On the bright side, the high school/college-aged segment (i.e., 15 – 24 years-old) is forecasted to see a growth of 6.9 percent or almost 8,000 people. The goal now is to ensure that we are able to convince them to stay after they complete their education. Our hope is that the development and implementation of a comprehensive, collaborative strategy will accomplish that goal as well as attract others who have either left or are searching for a great place to put down roots.
Source: U.S. Census Bureau for 2010 Census; Demographics Now for 2020 estimates
Consumer Price Index / Inflation Rates
The national inflation rate from September 2019 to September 2020 is 1.4%. This rate is a modest increase from the 1.3% rate in the August 2019 to August 2020 period. Nationally, the inflation rate in 2020 has been trending downward from 2.5% in January to as low as 0.1% in May and then modestly increasing through the June to September period.
Knoxville falls into the South Size Class B/C (population of 2.5 million or less) grouping. The current inflation rate for this region is 1.5% for the September 2019 to September 2020 period. This rate is up from the 1.2% rate in the August 2019 to August 2020 period. Similar to the national rate, the South Region’s B/C class inflation rate has been trending downward in 2020 from 2.3% in January to as low as -0.3% in May and then modestly trending upward back into positive territory through the June to September period.
Source: U.S. Bureau of Labor Statistics; Consumer Price Index, not seasonally adjusted
Housing Market
Home sales in the Knoxville area increased 2% in September, up 21.3% from last year. Home sales in the South increased 8.5% in September, up 22.3% from last September. Nationally, home sales in September increased 9.4% from August and are up 21% from last September. This shows four consecutive months of national home sales gains.
Housing inventories remain tight nationally, regionally, and locally which continues to drive median home prices higher. The median home sales price in the Knoxville area was $232,900 (up 0.4% from August and up 14.7% from September 2019). The median home sales price in the South was $266,900 (up 13% from last September). The national median home sales price in September was $311,800 (up 14.8% from last year).
Sources: National Association of Realtors®; Knoxville Area Association of Realtors
Sources: U.S. Housing & Urban Development – SOCDS – State of the Cities Data Systems; U.S. Census Bureau – Building Permits Survey
National Retail Sales
The total advance monthly retail sales estimate for September 2020 was $531.17 billion (down 2.7% from August but up 6.4% from last September).
The retail sectors that showed the most growth from this time last year were Non-store Retailers (+29.3%), Sporting Goods/Books/Hobby/Music Stores (+24.0%), Building Materials (+23.7%), Motor Vehicle and Parts Sales (+12.3%), and Furniture and Home Furnishings (+9.5%).
The retail sectors that experienced the biggest declines in sales from last September were: Clothing Stores (-14.8%), Gasoline Stations (-14.8%), Food Services and Drinking Places (-13.6%), and Electronics and Appliances Stores (-6.6%).
Consumers in these COVID-19 pandemic times are continuing to make more purchases online through non-store retailers like Amazon and Wayfair, doing more home improvement projects, buying more groceries to eat at home, and trying to exercise and entertain themselves at home.
Low consumer confidence due to COVID-19 fears and mixed messaging from government continue to slow the economic recovery as was referenced in last month’s report.
Sources: U.S. Census Bureau; Advance Monthly Retail Trade Reports, not adjusted
Tennessee State and Local Sales Tax Collections
The nine-county Knoxville MSA region collected $94.7 million in state sales taxes in September (down 4.6% from August and down 0.5% from last September) and Knox County collected $58.6 million in September (down 3.7% from August and down 3.0% from last September). The state of Tennessee collected $826.7 million in state sales taxes in September (down 3.6% from August and up 1.6% from last September).
The Knoxville MSA collected $31.7 million in local sales taxes (down 3.3% from August and up 10.4% from last September) and Knox County collected $19.1 million (down 0.8% from August and up 9.1% from last September).
Source: Tennessee Department of Revenue
McGhee Tyson Airport (TYS) Passenger and Freight Trends
The Metropolitan Knoxville Airport Authority recorded 86,264 passengers in August (down 6.7% from July passenger traffic and down 63% from the 233,423 passengers recorded in August 2019).
COVID-19 continues to hamper the airline industry. Fitch Ratings estimates that North American air travel will remain around 65% below 2019 baseline levels and forecasts air travel in 2021 to be around 30 to 40% below 2019 baseline levels. The full Fitch Ratings article can be read here.
The total freight recorded in August at TYS was 7,010,782 tons (down 5.4% from July and down 10% from last August).
Source: Metropolitan Knoxville Airport Authority


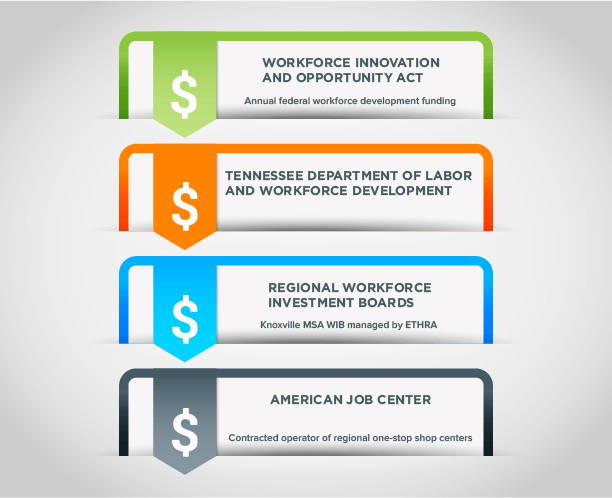 To the left is a flow chart showing how Workforce Innovation and Opportunity Act funds (annual federal workforce development funding) is distributed down to the local American Job Center.