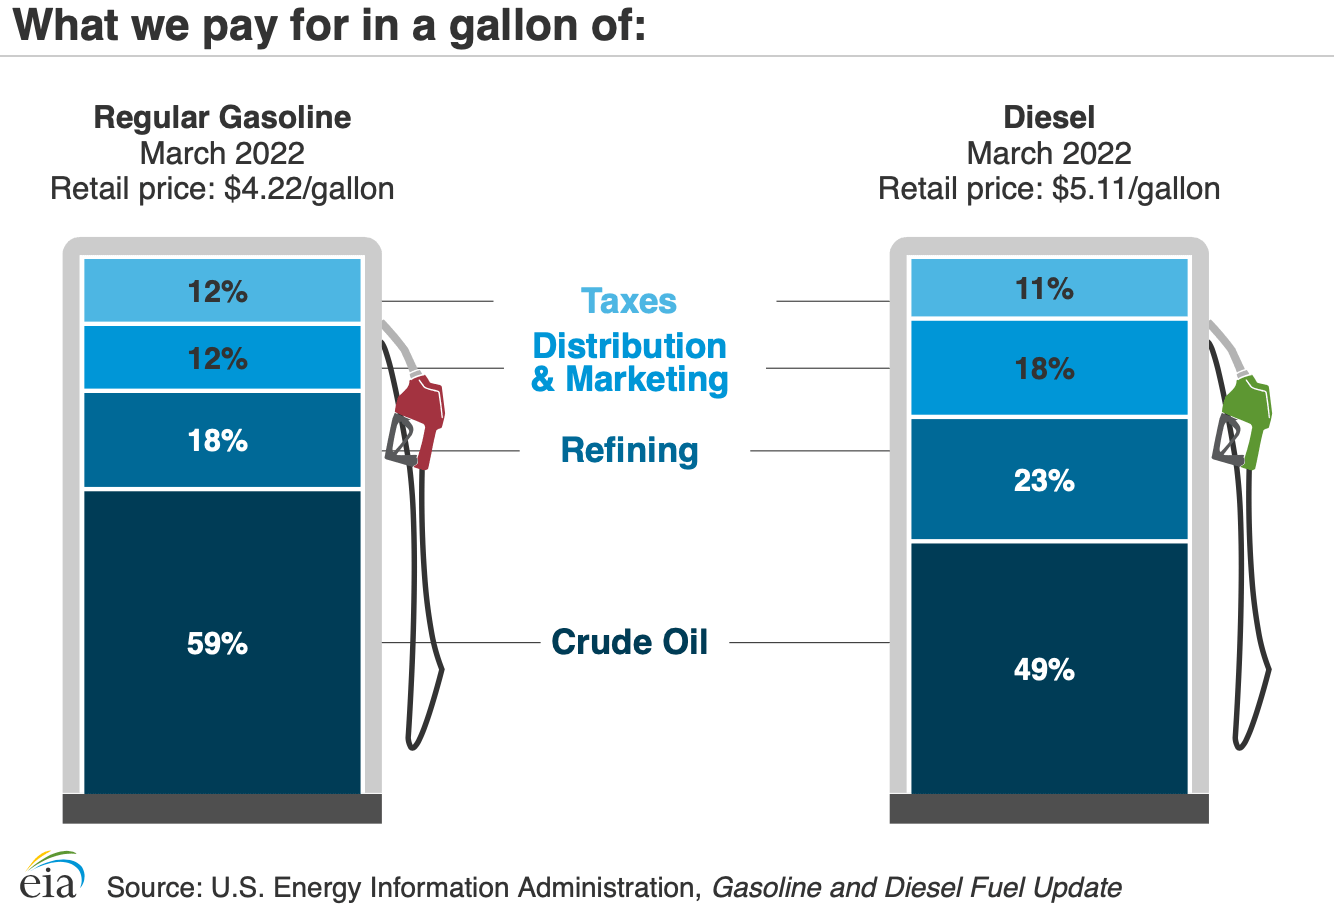
Rising Gas Prices and the Effects on Businesses
In addition to our regular monthly survey questions, we asked respondents if the rising price of gas has been affecting their business and if so, in what ways.
Over three-quarters (78%) of respondents indicated that the rising price of gas is negatively impacting their business. For the other 22% of respondents, we can only assume that their business operations are office-based, don’t have vehicle fleets, or that the rising price of gas may only affect them as individuals and not as a business line item.
Respondents indicated that increased gas and diesel prices impact businesses with large fleets of vehicles especially hard. These businesses include trucking firms, construction companies, repair contractors, landscapers, and many other service providers. Increased shipping and freight costs are cutting into the net profits of many businesses. Some businesses indicate that they can’t pass the increased shipping costs onto customers due to “set price” contracts or the fear of losing customers. Manufacturers are seeing increased costs for raw materials that are linked to oil such as rubber and plastic products.
According to AAA, “as supply remains tight and the market remains highly volatile, crude prices will likely continue to fluctuate, pushing pump prices higher.” You can read more here.
Labor Market Information
The Knoxville MSA’s unemployment rate in March was 2.6% (this was lower than February’s 2.8% rate and much lower than the 4.5% rate from March 2021.) Knox County’s unemployment rate in March was 2.4% (down from 2.5% in February and down from 4.1% in March 2021.) Tennessee’s unemployment rate was 3.0% in March (down from 3.3% in February and down from 5.1% in last March.) The U.S. unemployment rate was 3.8% in March (down from the 4.1% rate in February and down from the 6.2% unemployment rate recorded last March.)
The size of the total labor force increased only slightly from February to March at the local, state, and national levels. The Knoxville MSA’s labor force only increased 0.5% (from 444,574 in February to 446,627 in March.) Knox County’s labor force only increased 0.5% (from 253,576 in February to 254,838 in March.) Tennessee’s labor force only increased 0.1% (from 3,389,300 in February to 3,393,916 in March.) The national labor force only increased 0.3% (from 163,725,000 in February to 164,274,000 in March.)
Below is the 13-month unemployment rates trending comparison for the four largest MSA’s in Tennessee –
(Source: U.S. Bureau of Labor Statistics; Tennessee Dept. of Labor & Workforce Development)
Job Market
Data Note: Emsi, our source for job postings data in ECO – financed by First Horizon Bank, has merged with Burning Glass and is now using a new integrated feed for job postings data that allows for further deduplication of job postings, better employer tagging, and improved industry classification. Analysis for the current estimates, top 10 job posting industries, top 10 occupations, and the 13-month job posting trends for Knox County and Knoxville MSA reflect Emsi Burning Glass’ new methodology.
For the month of March, there were 10,923 unique active job postings in the Knoxville MSA (down 0.7% from February and up 30.4% from last March.) There were 7,469 unique active job postings in Knox County (down 0.4% from February and up 27.8% from this time last year.)
The Top 10 industries (by number of job postings) in the Knoxville MSA in March were –
The Top 10 occupations (by number of job postings) in the Knoxville MSA in March were –
You can view the 13-month job postings trend for Knox County and the Knoxville MSA below.
(Source: EMSI Job Postings Analytics)
ADP National Employment Report®
Each month, ADP, a large-scale payroll and human resources company releases their National Employment Report®, which provides a high-level look at month-over-month private-sector employment changes across the country.
The March report shows a gain of 455,000 in nonfarm private-sector employment (a decrease from the 475,000 jobs gain reported in February.) Midsized businesses (50-499 employees) posted the largest gain with an increase of 188,000 jobs, large firms (500+ employees) gained 177,000 jobs, and small businesses (1-49 employees) gained 90,000 jobs.
ADP’s Small Business Report, which further synthesizes the small business landscape, shows that the 90,000 jobs gain was driven mostly by “Other Small” businesses (20-49 employees) which increased by 53,000 jobs. The “Very Small” businesses (1-19 employees) increased by 37,000 jobs.
(Source: ADP)
Worker Shortage Update
The labor shortages are persisting longer than many economists expected. There continues to be high job demand and slower workforce growth resulting in fierce competition for talent and many open jobs going unfilled. According to the latest data from the U.S. Bureau of Labor Statistics (BLS), the nation had 11.5 million jobs to fill in March, meaning there is now an unprecedented two job openings for every unemployed person. It will take time for this mismatch between labor demand and supply to align. In the meantime, wages will continue to rise as businesses compete to attract talent. You can read the latest job openings summary from BLS here.
In the February 2022 issue of ECO, we wrote about what Bharat Ramamurti, the National Economic Council Deputy Director, recently coined “The Great Upgrade” in which many people who quit their jobs were looking to change careers or “upgrade” from their last job. Further evidence of career transitions in the labor force can be found in recent research from The Oliver Wyman Forum, a consulting firm and think tank, that shows non-college degreed blue-collar workers are making the transition toward tech jobs. They have been coined the “New Collars.” They are blue-collar workers who have quit their low-paying jobs in warehousing, manufacturing, hospitality, and other hourly positions in the past two years and have transitioned over to “new collar” roles that provide on-the-job training tech skills, better pay and flexible schedules. Many of these workers did not have the option to work remotely due to the nature of their jobs or they were considered “essential workers.” Tech job postings have increased significantly over the past two years and with the very tight labor market, many companies have waived some prequalifications such as prior work experience or a four-year college degree. This has opened an array of new career options for the “New Collars.” You can read more here.
As we continue to see more tightening in the labor market and a major realignment in the job market, we can expect increasing pressure on wages, sign-up bonuses, job flexibility, and childcare options. As a region, we must figure out how we can significantly increase the size of our local labor force through talent attraction (recruiting more people aged 25-54 to our region), talent retention (keeping recent college graduates and people aged 25-54 here), and immigration reform (increasing work visas and the ability to recruit specialized talent from abroad) in order to meet our region’s ever increasing job demand.
Consumer Price Index (CPI – Inflation Rates)
The national inflation rate from March 2021 to March 2022 is 8.5%. This is up from the 7.9% rate from February 2021 to February 2022. Last year, the national inflation rate was 2.6% from March 2020 to March 2021. Higher inflation is primarily being driven by the supply chain disruptions and pent-up consumer demand for goods and has persisted longer than the Feds expected with price increases hitting 40-year highs. Gasoline prices rose 18% from February, largely driven by the ongoing Russian war in Ukraine and grocery prices are up 10%. You can read more here.
The Federal Reserve raised the benchmark short-term interest rate at its March meeting for the first time since 2018. After two years of holding the borrowing rate near zero, the Fed voted to raise the key rate to a target range of 0.25% to 0.5% and further signaled that there would be more hikes at the Fed’s six remaining meetings this year to fight inflation. You can read more here. The average 30-year fixed-rate mortgage rose to 5.11% in the week ending April 21, marking the seventh consecutive week of increases and a twelve-year high. For comparison, the average mortgage rate was 2.97% this time last year. You can read more here.
Knoxville falls into the South Size Class B/C (population of 2.5 million or less) grouping. The current inflation rate for this region is 9.1% for the March 2021 to March 2022 period. This is up from 8.4% in the February 2021 to February 2022 period. Last year, the rate was 3.0% for March 2020 to March 2021.
(Source: U.S. Bureau of Labor Statistics; Consumer Price Index, not seasonally adjusted)
Housing Market
Home sales in the Knoxville area declined 7.7% in March to a seasonally adjusted annual rate (SAAR) of 22,754. Similarly, home sales in Knox County declined 9.7% from the previous month to a seasonally adjusted annual rate (SAAR) of 7,807. Compared to the previous year, home sales in the Knoxville area declined 2.1% and 15.1% in Knox County.
Nationally, existing-home sales decreased to a seasonally adjusted annual rate of 5.77 million in March — down 2.6% from the previous month and 4.5% from a year ago. Home sales in the South similarly declined 3.0% from the previous month and 3.0% from one year prior.
The median home sales price in the Knoxville area was $310,000 in March — up 21.6% from one year ago. Knox County’s median home sale price was $327,450 – up 26.6% from one year ago.
Forty-three percent of homes sold for over asking price in March, compared to 43% the previous month. 26.5% of homes sold for at least $10,000 over asking price and 12% sold for at least $25,000 over asking price. New construction (i.e., “Never Occupied,” “To Be Built,” “Under Construction,” or “Under Roof”) represented 9.3% of total home sales, though move-in ready homes accounted for only 23% of all new construction sales.
In the Knoxville area, total inventory was down just 1% from a year ago but remains down more than 60% from pre-pandemic levels. Inventory in Knox County was down 22.5% year-over-year. Half of homes sold in the Knoxville area were on the market for 4 days or less. Months of inventory, or the number of months it would take to exhaust active listings at the current sales rate, was 1.1 months.
According to Hancen Sale, Governmental Affairs and Policy Director at the Knoxville Area Association of Realtors®, “Knoxville’s housing market is showing signs of moderation, in part because of eroding housing affordability due to higher home prices, limited (but rising) inventory, and rising mortgage rates.”
Knoxville Area Association of REALTORS® (KAAR) reports monthly home sales patterns using a seasonally adjusted annualized rate (SAAR), an adjusted rate that takes into account typical seasonal fluctuations in data and is expressed as an annual total. Comparing month-over-month housing market data using this method provides a more accurate depiction of home sales.
(Sources: National Association of Realtors®; Knoxville Area Association of Realtors)
(Sources: U.S. Housing & Urban Development – SOCDS – State of the Cities Data Systems; U.S. Census Bureau – Building Permits Survey)
National Retail Sales
The total advance monthly retail sales estimate for March 2022 was $677.211 billion (up 17.3% from February and up 7.9% from last March.)
The retail sectors that showed the greatest growth from last March were Gasoline Stations (+40.3%), Food Services and Drinking Places (+22.3%), Clothing Stores (+17.2%), Miscellaneous Stores (+16.2%), Furniture and Home Furnishing Stores (+10.9%), Food and Beverage Stores (+9.3%), and General Merchandise Stores (+8.7%). Retail sectors that showed a decline in sales from last March were Electronics and Appliance Stores (-11.1%), Health and Personal Care Stores (-3.0%), Sporting Goods/Books/Hobby/Music Stores (-2.5%), and Non-store Retailers (-1.8%).
Most retail sectors continue to benefit from pent up customer demand and increased leisure travel despite rising inflation.
(Sources: U.S. Census Bureau; Advance Monthly Retail Trade Reports, not adjusted)
Tennessee State and Local Sales Tax Collections
The Knoxville MSA region collected $101.951 million in state sales taxes in March (up 4.1% from February and up 13.9% from last March) and Knox County collected $68.295 million in March (up 7.3% from February and up 19.5% from last March.) The state of Tennessee collected $961.457 million in state sales taxes in March (up 3.0% from February and up 25.5% from last March.)
The Knoxville MSA collected $35.974 million in local sales taxes in March (statistically unchanged from February and up 15.5% from last March) and Knox County collected $22.843 million (up 3.0% from February and up 21.1% from last March.)
(Source: Tennessee Department of Revenue)
Recent Business Expansions and New Business Announcements in the Knoxville Region
In this section of ECO, we share announcements of businesses that are expanding their existing operations or locating a new facility in the Knoxville region. If you would like to share your business expansion announcement with us, please send your info to [email protected].
New and existing industries continue to invest in the Knoxville region.
April 4, 2022 – TRISO-X LLC, a subsidiary of X-energy LLC, announced that the Horizon Center Industrial Park in Oak Ridge will be the future site of the nation’s first High-Assay Low-Enriched Uranium (HALEU) based fuel fabrication facility – the TRISO-X Fuel Fabrication Facility (TF3). This commercial advanced nuclear reactor fuel fabrication facility is scheduled for commissioning and start-up in 2025 through funding, in part, from the U.S. Department of Energy’s Advanced Reactor Demonstration Program. TF3 is projected to create 400 new jobs and an investment of nearly $300 million. You can read more here.
Knox County Business Licenses
New business licenses issued in March 2022 by Knox County are up 3.3% from March 2021 during the pandemic and are also up 12.3% from the pre-pandemic March 2019 count.
A total of 284 new business licenses were issued in March 2022 compared to 275 in March 2021 and 253 in March 2019. The top industry sectors for which business licenses were issued in March 2022 were services, retail, construction, and non-classified establishments.
Below is a chart showing the 13-month trend of business licenses issued by Knox County.
(Sources: Knox County Clerk)
McGhee Tyson Airport (TYS) Passenger and Freight Trends
The Metropolitan Knoxville Airport Authority recorded 201,833 passengers in March (up 37.1% from February’s passenger traffic of 147,168 and up 61.8% from COVID-ravaged March 2021.) This month’s passenger estimate is only down 1.3% from pre-COVID March 2019 – an encouraging sign that local air travel may be getting closer to normal.
According to the Transportation Security Administration, the average daily number of passengers passing through the nation’s TSA checkpoints in March was 2,053,002 (up 65% from the March 2021 daily passenger average of 1,243,955 but still down 12.4% from the pre-COVID March 2019 average of 2,344,640.) You can view the daily TSA checkpoint travel numbers here.
According to the International Air Transport Association (IATA), “Improving pandemic developments at the global level bode well for the air travel recovery in 2022, though the geopolitical issues in Eastern Europe combined with rising inflationary pressures will negatively impact some markets. For now, the bookings for future travel to, from and within the Americas region do not show any significant impact of the conflict.” You can read IATA’s full State of the Region: The Americas Report here.
(Sources: Metropolitan Knoxville Airport Authority; U.S. Transportation Security Administration; International Air Transport Association)


